背景简介
继续上文的ceph性能调整,有兴趣的可以看看:
文章目录[隐藏] 前言 集群配置 开始测试 前言 最近在折腾CEPH集群,测试环境是4台ceph物理节点,每台8~12个SATA/SAS机械硬盘,共43个OSD。性能远低于预期,目前正在调整配置中...... 正好实测了一下性能,这里分享出来大家参考。对CEPH Pool的性能测试可以看前一篇: 集群配置 4 CEPH节点:SH-1001 SH-1003 SH-1004 SH-1005 2Manager:SH-1001 SH-1005 3Monitor:SH-1004 SH-2001 SH-2003 开始测试 内网测速 root@SH-1005:~# iperf3 -s ----------------------------------------------------------- Server listening on 5201 ----------------------------------------------------------- Accepted connection from 10.1.0.1, port 42784 [ 5] local 10.1.0.5 port 5201 connected to 10.1.0.1 port 42786 [ ID] Interval Transfer Bitrate [ 5] 0.00-1.00 […]

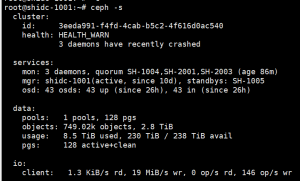
文章目录[隐藏] 前言 集群配置 开始测试 前言 最近在折腾CEPH集群,测试环境是4台ceph物理节点,每台8~12个SATA/SAS机械硬盘,共43个OSD。性能远低于预期,目前正在调整配置中...... 正好实测了一下性能,这里分享出来大家参考。简要信息通过ceph -s即可获取: 集群配置 4 CEPH节点:SH-1001 SH-1003 SH-1004 SH-1005 2Manager:SH-1001 SH-1005 3Monitor:SH-1004 SH-2001 SH-2003 开始测试 内网测速 root@SH-1005:~# iperf3 -s ----------------------------------------------------------- Server listening on 5201 ----------------------------------------------------------- Accepted connection from 10.1.0.1, port 42784 [ 5] local 10.1.0.5 port 5201 connected to 10.1.0.1 port 42786 [ ID] Interval Transfer Bitrate [ 5] 0.00-1.00 […]
测试环境的Ceph集群配置同前文,所以就不赘述了。将上述的Ceph pool中新建raw格式的ceph rbd,并挂载在虚拟机的/vz下,qemu cache设置为writeback
[root@hn03 ~]# df -h

Filesystem                            Size  Used Avail Use% Mounted on

devtmpfs                              126G     0  126G   0% /dev

tmpfs                                 126G   12K  126G   1% /dev/shm

tmpfs                                 126G 1008K  126G   1% /run

tmpfs                                 126G     0  126G   0% /sys/fs/cgroup

/dev/sda4                             165G  5.7G  151G   4% /

tmpfs                                 126G   20K  126G   1% /tmp

/dev/sda2                             976M  170M  739M  19% /boot

/dev/mapper/vhs_jelastic--host--3-vz  8.0T   17G  7.6T   1% /vz

/dev/ploop13141p1                     9.8G  1.3G  8.0G  14% /vz/pfcache

10.1.3.2:/home/nfs/backup/hn03         33T   24T  7.3T  77% /vz/backups

/dev/ploop48143p1                     241G  548M  230G   1% /vz/root/2629

tmpfs                                  26G     0   26G   0% /run/user/0
开始测试
4K随机写性能
[root@hn03 ~]# fio -filename=/vz/test_4kwrite -direct=1 -iodepth 1 -thread -rw=randwrite -ioengine=psync -bs=4k -size=100M -numjobs=10 -runtime=60 -group_reporting -name=test4kwrite

test4kwrite: (g=0): rw=randwrite, bs=(R) 4096B-4096B, (W) 4096B-4096B, (T) 4096B-4096B, ioengine=psync, iodepth=1

...

fio-3.14

Starting 10 threads

test4kwrite: Laying out IO file (1 file / 100MiB)

Jobs: 10 (f=10): [w(10)][100.0%][w=4336KiB/s][w=1084 IOPS][eta 00m:00s]

test4kwrite: (groupid=0, jobs=10): err= 0: pid=292932: Sun Dec 13 16:10:38 2020

  write: IOPS=2454, BW=9820KiB/s (10.1MB/s)(577MiB/60196msec)

    clat (usec): min=141, max=1677.1k, avg=4061.46, stdev=52237.91

     lat (usec): min=142, max=1677.1k, avg=4062.74, stdev=52237.96

    clat percentiles (usec):

     |  1.00th=[    157],  5.00th=[    161], 10.00th=[    163],

     | 20.00th=[    167], 30.00th=[    174], 40.00th=[    180],

     | 50.00th=[    184], 60.00th=[    190], 70.00th=[    200],

     | 80.00th=[    215], 90.00th=[    258], 95.00th=[  10945],

     | 99.00th=[  53216], 99.50th=[  68682], 99.90th=[1216349],

     | 99.95th=[1350566], 99.99th=[1619002]

   bw (  KiB/s): min=  159, max=48638, per=100.00%, avg=14139.18, stdev=1074.69, samples=836

   iops        : min=   39, max=12158, avg=3534.29, stdev=268.68, samples=836

  lat (usec)   : 250=89.14%, 500=4.80%, 750=0.06%, 1000=0.01%

  lat (msec)   : 2=0.03%, 4=0.10%, 10=0.72%, 20=1.17%, 50=2.83%

  lat (msec)   : 100=0.88%, 250=0.09%, 500=0.01%, 1000=0.02%, 2000=0.13%

  cpu          : usr=0.27%, sys=2.23%, ctx=295619, majf=0, minf=0

  IO depths    : 1=100.0%, 2=0.0%, 4=0.0%, 8=0.0%, 16=0.0%, 32=0.0%, >=64=0.0%

     submit    : 0=0.0%, 4=100.0%, 8=0.0%, 16=0.0%, 32=0.0%, 64=0.0%, >=64=0.0%

     complete  : 0=0.0%, 4=100.0%, 8=0.0%, 16=0.0%, 32=0.0%, 64=0.0%, >=64=0.0%

     issued rwts: total=0,147774,0,0 short=0,0,0,0 dropped=0,0,0,0

     latency   : target=0, window=0, percentile=100.00%, depth=1

Run status group 0 (all jobs):
WRITE: bw=9820KiB/s (10.1MB/s), 9820KiB/s-9820KiB/s (10.1MB/s-10.1MB/s), io=577MiB (605MB), run=60196-60196msec
Disk stats (read/write):
dm-0: ios=1/148479, merge=0/0, ticks=74/176011, in_queue=218493, util=96.85%, aggrios=1/147862, aggrmerge=0/636, aggrticks=74/158079, aggrin_queue=159152, aggrutil=96.39%
sdb: ios=1/147862, merge=0/636, ticks=74/158079, in_queue=159152, util=96.39%
4k随机读
[root@hn03 ~]# fio -filename=/vz/test_4kread -direct=1 -iodepth 1 -thread -rw=randread -ioengine=psync -bs=4k -size=100M -numjobs=10 -runtime=60 -group_reporting -name=test4kread

test4kread: (g=0): rw=randread, bs=(R) 4096B-4096B, (W) 4096B-4096B, (T) 4096B-4096B, ioengine=psync, iodepth=1

...

fio-3.14

Starting 10 threads

Jobs: 2 (f=2): [_(1),r(1),_(1),r(1),_(6)][100.0%][r=42.4MiB/s][r=10.8k IOPS][eta 00m:00s]

test4kread: (groupid=0, jobs=10): err= 0: pid=303812: Sun Dec 13 16:17:48 2020

  read: IOPS=7743, BW=30.2MiB/s (31.7MB/s)(1000MiB/33062msec)

    clat (usec): min=6, max=465810, avg=1267.16, stdev=6697.91

     lat (usec): min=7, max=465811, avg=1268.53, stdev=6697.91

    clat percentiles (usec):

     |  1.00th=[   145],  5.00th=[   167], 10.00th=[   186], 20.00th=[   239],

     | 30.00th=[   478], 40.00th=[   709], 50.00th=[   766], 60.00th=[   824],

     | 70.00th=[   881], 80.00th=[   955], 90.00th=[  1090], 95.00th=[  1270],

     | 99.00th=[ 20579], 99.50th=[ 37487], 99.90th=[ 74974], 99.95th=[119014],

     | 99.99th=[283116]

   bw (  KiB/s): min=  552, max=62816, per=100.00%, avg=31085.23, stdev=2034.02, samples=648

   iops        : min=  138, max=15704, avg=7770.71, stdev=508.54, samples=648

  lat (usec)   : 10=0.04%, 20=0.05%, 50=0.05%, 100=0.02%, 250=21.29%

  lat (usec)   : 500=8.64%, 750=16.49%, 1000=37.87%

  lat (msec)   : 2=13.23%, 4=0.26%, 10=0.57%, 20=0.47%, 50=0.79%

  lat (msec)   : 100=0.16%, 250=0.05%, 500=0.01%

  cpu          : usr=1.08%, sys=6.70%, ctx=256844, majf=0, minf=10

  IO depths    : 1=100.0%, 2=0.0%, 4=0.0%, 8=0.0%, 16=0.0%, 32=0.0%, >=64=0.0%

     submit    : 0=0.0%, 4=100.0%, 8=0.0%, 16=0.0%, 32=0.0%, 64=0.0%, >=64=0.0%

     complete  : 0=0.0%, 4=100.0%, 8=0.0%, 16=0.0%, 32=0.0%, 64=0.0%, >=64=0.0%

     issued rwts: total=256000,0,0,0 short=0,0,0,0 dropped=0,0,0,0

     latency   : target=0, window=0, percentile=100.00%, depth=1

Run status group 0 (all jobs):
READ: bw=30.2MiB/s (31.7MB/s), 30.2MiB/s-30.2MiB/s (31.7MB/s-31.7MB/s), io=1000MiB (1049MB), run=33062-33062msec
Disk stats (read/write):
dm-0: ios=255350/0, merge=0/0, ticks=305061/0, in_queue=306628, util=99.92%, aggrios=255590/0, aggrmerge=0/0, aggrticks=305374/0, aggrin_queue=305203, aggrutil=99.72%
sdb: ios=255590/0, merge=0/0, ticks=305374/0, in_queue=305203, util=99.72%
顺序写
[root@hn03 ~]# fio -filename=/vz/test_seqwrite -direct=1 -iodepth 1 -thread -rw=write -ioengine=psync -bs=1G -size=10G -numjobs=10 -runtime=60 -group_reporting -name=testseqwrite

testseqwrite: (g=0): rw=write, bs=(R) 1024MiB-1024MiB, (W) 1024MiB-1024MiB, (T) 1024MiB-1024MiB, ioengine=psync, iodepth=1

...

fio-3.14

Starting 10 threads

testseqwrite: Laying out IO file (1 file / 10240MiB)

Jobs: 1 (f=1): [_(9),W(1)][13.6%][eta 12m:23s]

testseqwrite: (groupid=0, jobs=10): err= 0: pid=307042: Sun Dec 13 16:21:50 2020

  write: IOPS=0, BW=159MiB/s (167MB/s)(18.0GiB/115971msec)

    clat (msec): min=20002, max=64182, avg=50736.31, stdev=14795.11

     lat (msec): min=20103, max=64581, avg=50949.70, stdev=14763.00

    clat percentiles (msec):

     |  1.00th=[17113],  5.00th=[17113], 10.00th=[17113], 20.00th=[17113],

     | 30.00th=[17113], 40.00th=[17113], 50.00th=[17113], 60.00th=[17113],

     | 70.00th=[17113], 80.00th=[17113], 90.00th=[17113], 95.00th=[17113],

     | 99.00th=[17113], 99.50th=[17113], 99.90th=[17113], 99.95th=[17113],

     | 99.99th=[17113]

   bw (  MiB/s): min=16384, max=16384, per=100.00%, avg=16384.00, stdev= 0.00, samples=8

   iops        : min=   16, max=   16, avg=16.00, stdev= 0.00, samples=8

  lat (msec)   : >=2000=100.00%

  cpu          : usr=0.42%, sys=0.43%, ctx=380, majf=0, minf=0

  IO depths    : 1=100.0%, 2=0.0%, 4=0.0%, 8=0.0%, 16=0.0%, 32=0.0%, >=64=0.0%

     submit    : 0=0.0%, 4=100.0%, 8=0.0%, 16=0.0%, 32=0.0%, 64=0.0%, >=64=0.0%

     complete  : 0=0.0%, 4=100.0%, 8=0.0%, 16=0.0%, 32=0.0%, 64=0.0%, >=64=0.0%

     issued rwts: total=0,18,0,0 short=0,0,0,0 dropped=0,0,0,0

     latency   : target=0, window=0, percentile=100.00%, depth=1

Run status group 0 (all jobs):
WRITE: bw=159MiB/s (167MB/s), 159MiB/s-159MiB/s (167MB/s-167MB/s), io=18.0GiB (19.3GB), run=115971-115971msec
Disk stats (read/write):
dm-0: ios=0/37098, merge=0/0, ticks=0/17552840, in_queue=17710730, util=99.92%, aggrios=0/36944, aggrmerge=0/179, aggrticks=0/17266133, aggrin_queue=17265866, aggrutil=99.22%
sdb: ios=0/36944, merge=0/179, ticks=0/17266133, in_queue=17265866, util=99.22%
顺序读
[root@hn03 ~]# fio -filename=/vz/test_seqread -direct=1 -iodepth 1 -thread -rw=read -ioengine=psync -bs=1G -size=10G -numjobs=10 -runtime=60 -group_reporting -name=testseqread

testseqread: (g=0): rw=read, bs=(R) 1024MiB-1024MiB, (W) 1024MiB-1024MiB, (T) 1024MiB-1024MiB, ioengine=psync, iodepth=1

...

fio-3.14

Starting 10 threads

testseqread: Laying out IO file (1 file / 10240MiB)

Jobs: 1 (f=1): [_(6),R(1),_(3)][60.0%][eta 00m:46s]

testseqread: (groupid=0, jobs=10): err= 0: pid=319596: Sun Dec 13 16:30:05 2020

  read: IOPS=1, BW=1043MiB/s (1094MB/s)(70.0GiB/68729msec)

    clat (msec): min=967, max=10553, avg=8866.24, stdev=2072.27

     lat (msec): min=967, max=10553, avg=8866.24, stdev=2072.27

    clat percentiles (msec):

     |  1.00th=[  969],  5.00th=[ 2869], 10.00th=[ 5403], 20.00th=[ 9060],

     | 30.00th=[ 9329], 40.00th=[ 9329], 50.00th=[ 9463], 60.00th=[ 9597],

     | 70.00th=[ 9731], 80.00th=[ 9866], 90.00th=[10134], 95.00th=[10134],

     | 99.00th=[10537], 99.50th=[10537], 99.90th=[10537], 99.95th=[10537],

     | 99.99th=[10537]

   bw (  MiB/s): min=20447, max=20480, per=100.00%, avg=20472.62, stdev= 2.11, samples=60

   iops        : min=   15, max=   20, avg=18.69, stdev= 0.30, samples=60

  lat (msec)   : 1000=1.43%, 2000=1.43%, >=2000=97.14%

  cpu          : usr=0.00%, sys=3.04%, ctx=4613, majf=0, minf=6158

  IO depths    : 1=100.0%, 2=0.0%, 4=0.0%, 8=0.0%, 16=0.0%, 32=0.0%, >=64=0.0%

     submit    : 0=0.0%, 4=100.0%, 8=0.0%, 16=0.0%, 32=0.0%, 64=0.0%, >=64=0.0%

     complete  : 0=0.0%, 4=100.0%, 8=0.0%, 16=0.0%, 32=0.0%, 64=0.0%, >=64=0.0%

     issued rwts: total=70,0,0,0 short=0,0,0,0 dropped=0,0,0,0

     latency   : target=0, window=0, percentile=100.00%, depth=1

Run status group 0 (all jobs):
READ: bw=1043MiB/s (1094MB/s), 1043MiB/s-1043MiB/s (1094MB/s-1094MB/s), io=70.0GiB (75.2GB), run=68729-68729msec
Disk stats (read/write):
dm-0: ios=143360/4, merge=0/0, ticks=9562103/248, in_queue=9565573, util=99.98%, aggrios=143360/4, aggrmerge=0/1, aggrticks=9515022/245, aggrin_queue=9514757, aggrutil=99.95%
sdb: ios=143360/4, merge=0/1, ticks=9515022/245, in_queue=9514757, util=99.95%